Covid/Flu Forecasting
Some cool forecasting results as byproducts from my summer internship at CMU Delphi Group
TL;DR: Real-world forecasting is so much more troublesome yet fun!
Throughout the internship I found quite a few surprising tricks that really improve forecast drastically. These below are valuable, problem-and-context-specific observations that I would unlikely to experience on a regular Time Series class with friendly datasets!
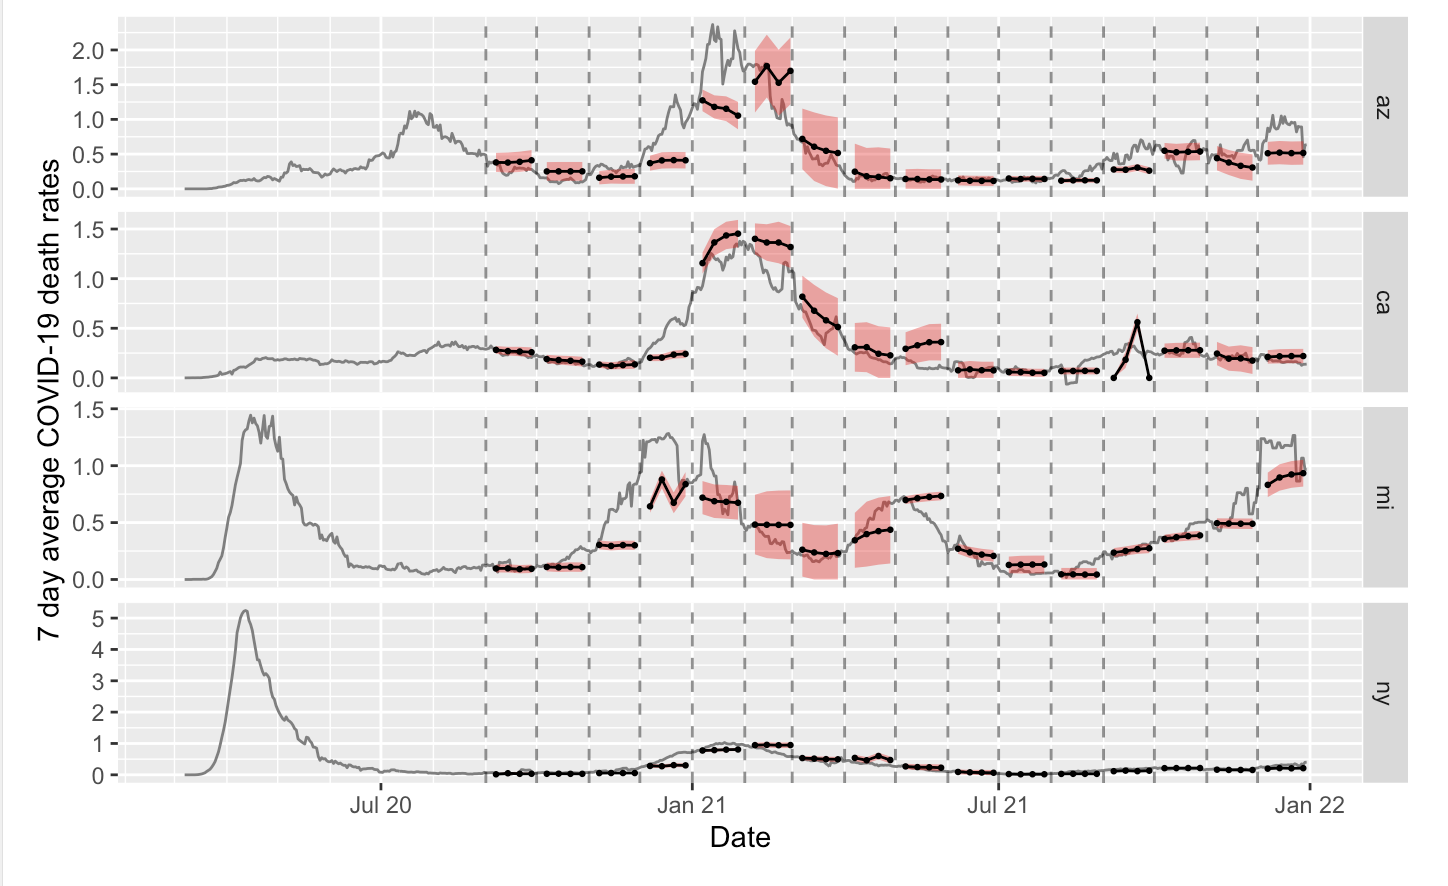
Magic trick #1: Geo-pooling (jointly training time-series models on data from multiple locations, equivalent to concatenating the feature and response vector if we are talking about regressions)
For context, I was fitting ARX model that used Covid case rate to predict death rate (measured as number of case/death per 100,000).
Before geo-pooling:
After: (Credit to my friend and colleague Ryan Nayebi)
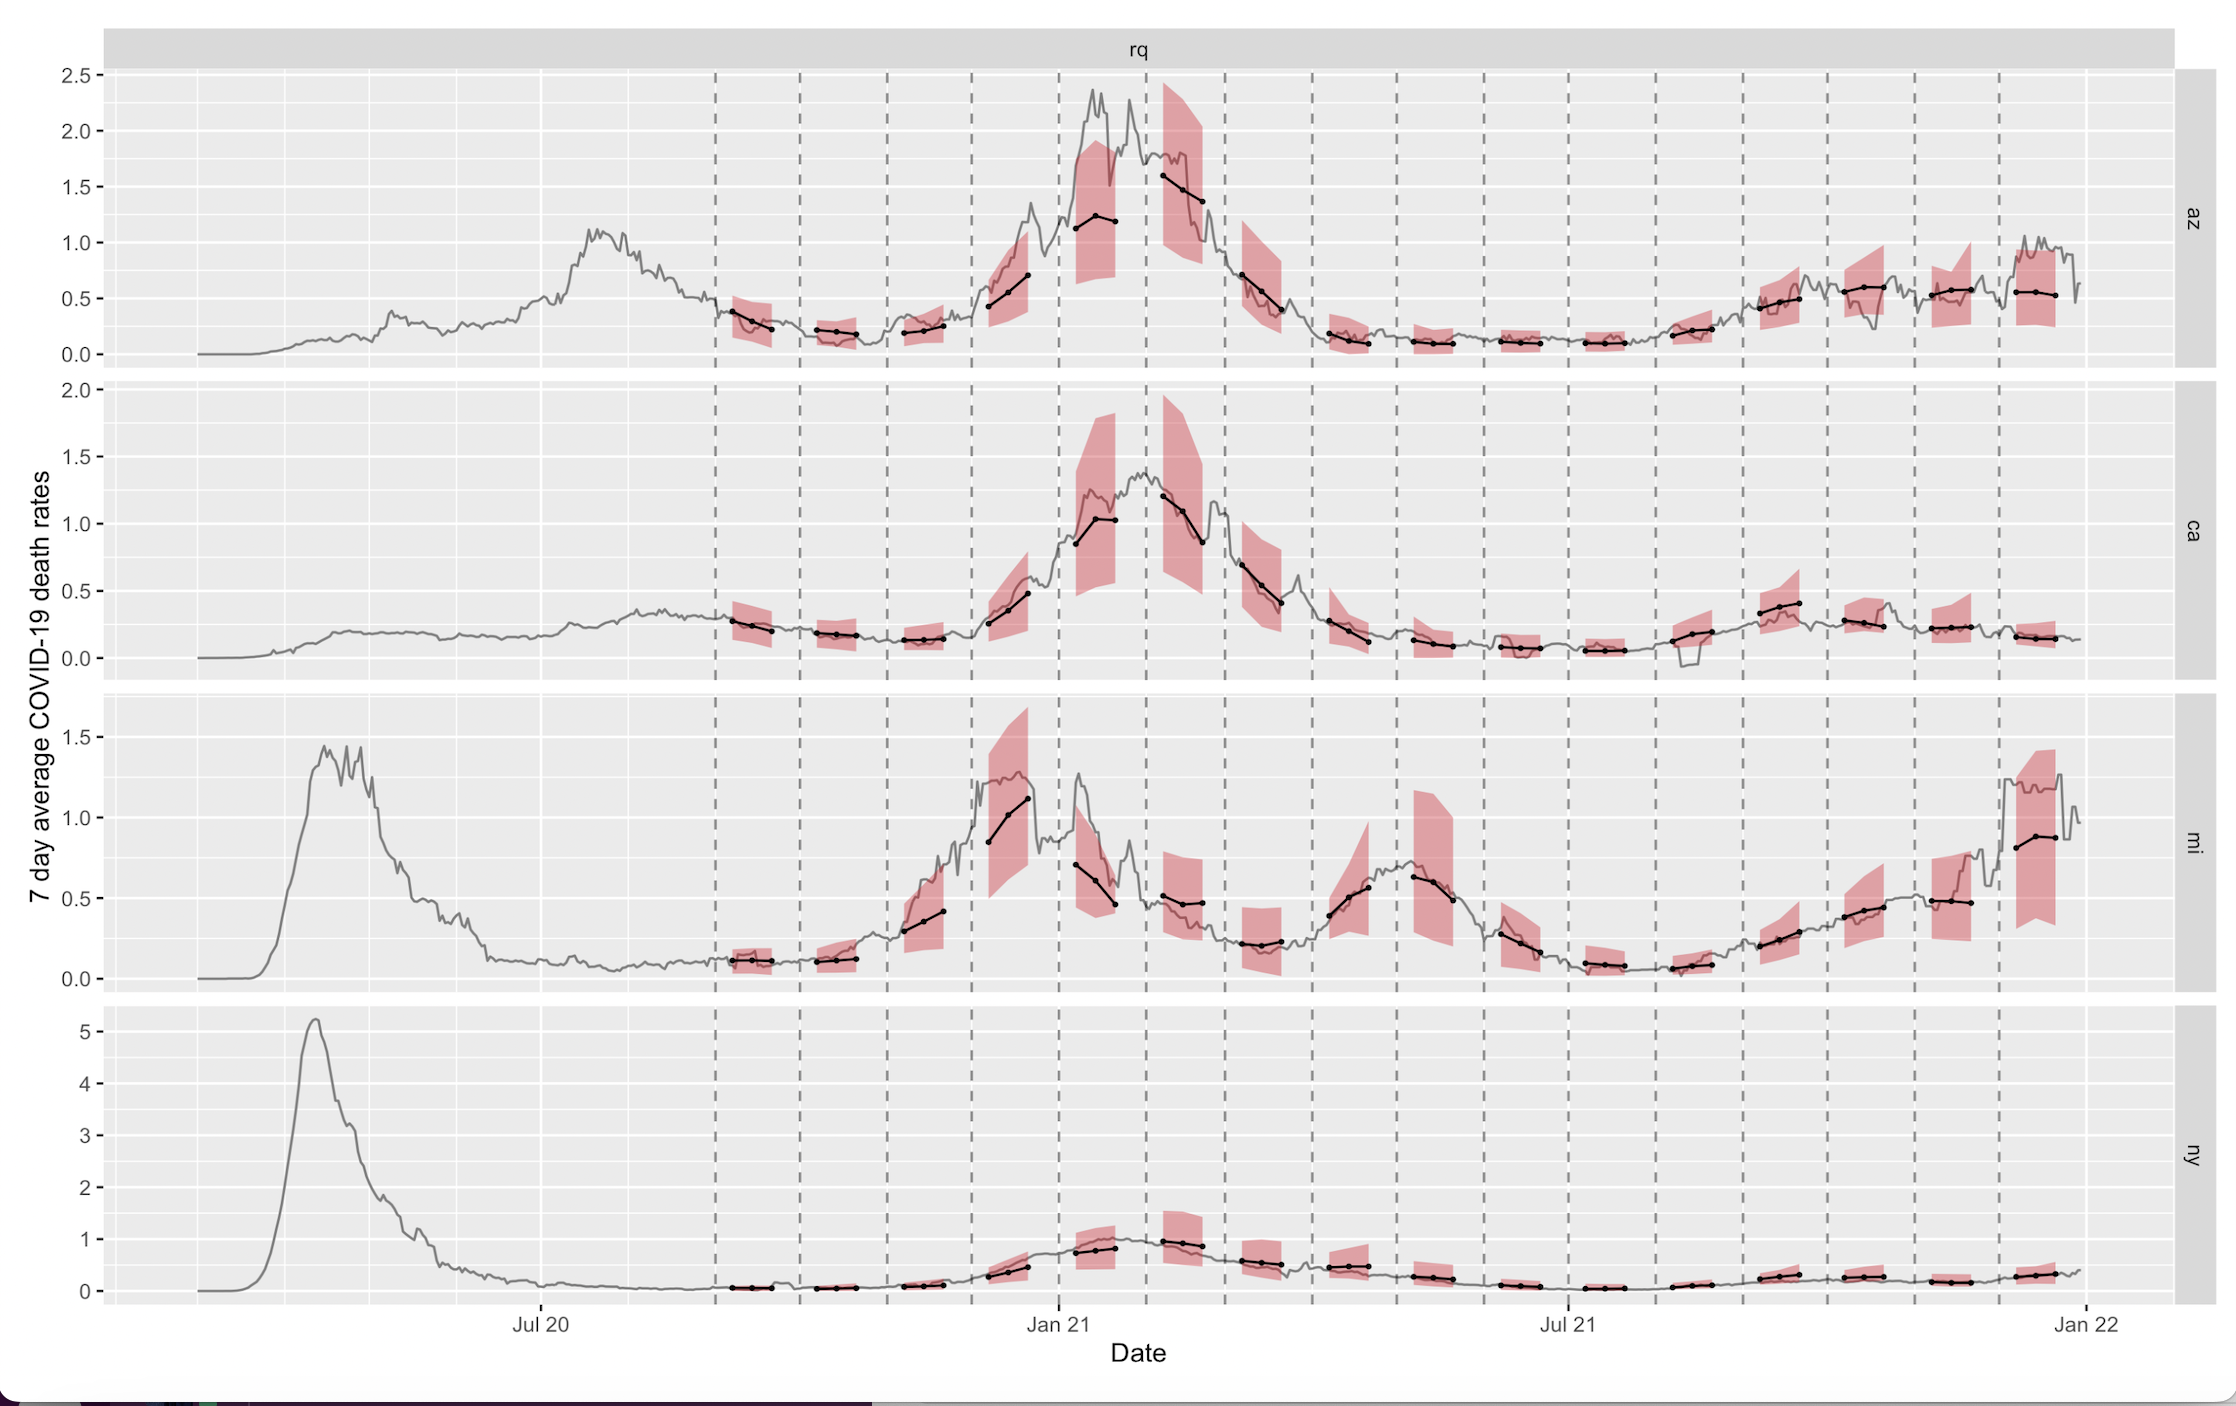
With data from multiple location the forecasts are becoming much more robust.
Magic Trick #2: Fourier Series
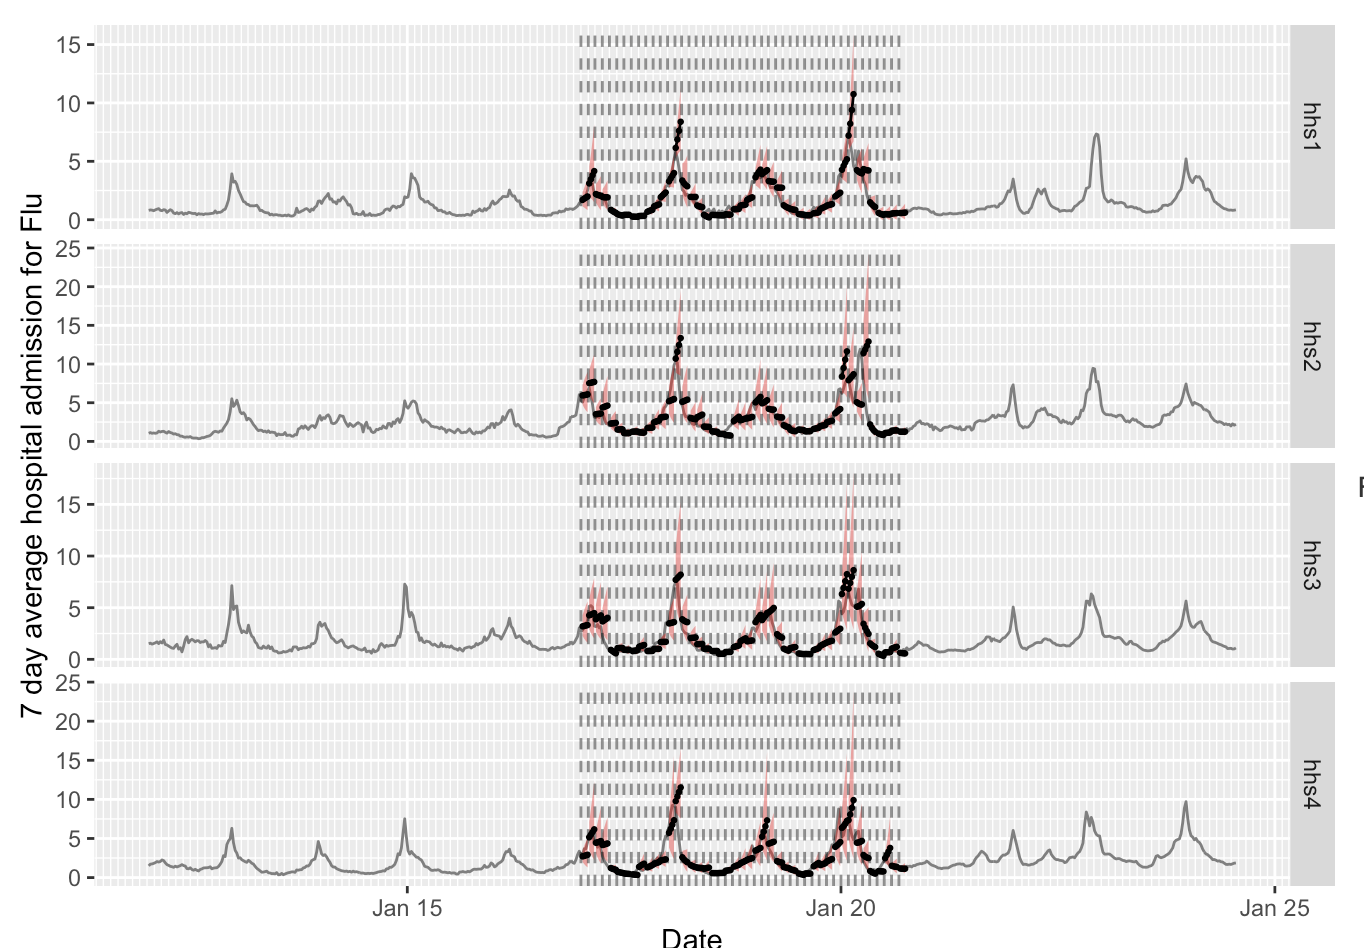
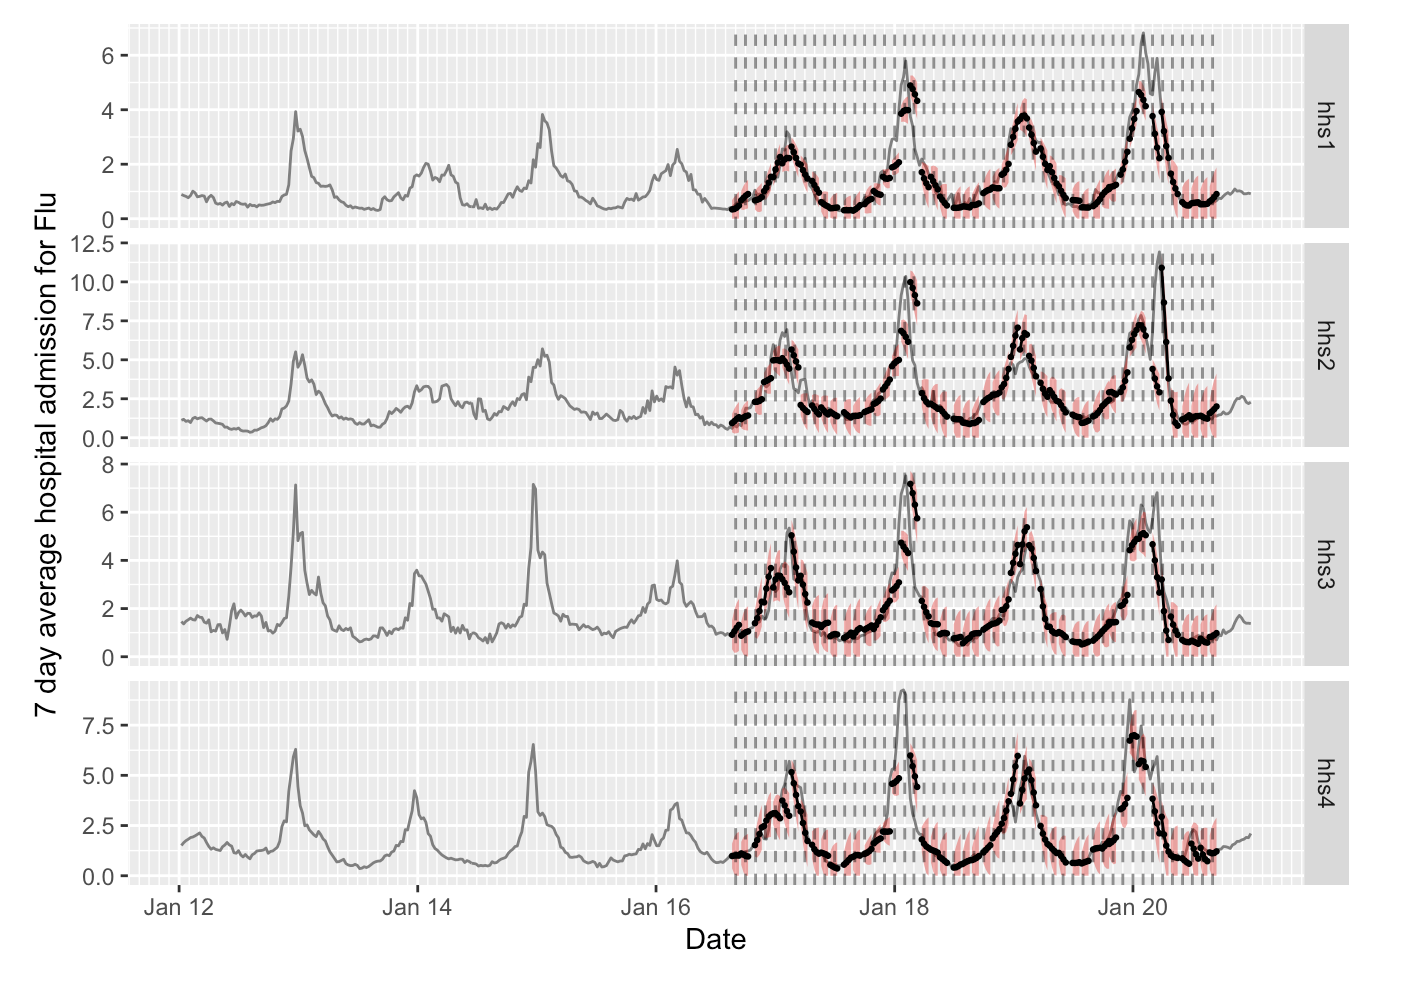
This time I am dealing with hospital admission rate for Flu. It turns out that traditional ETS methods does not support data with long seasonal periods (ETS requires an initial coefficient estimate for every phase of the period; our Flu data is weekly with an annual cycle which gives a period of 52 and results in too many coefficients for stable training). Instead, I adopt a method from this Rob Hyndman post and used 8 Fourier series as exogenous features which brought seasonality back to the stage.
Before (with ETS):
After:
Magic Trick #3: Signal Preprocessing (of course of course)
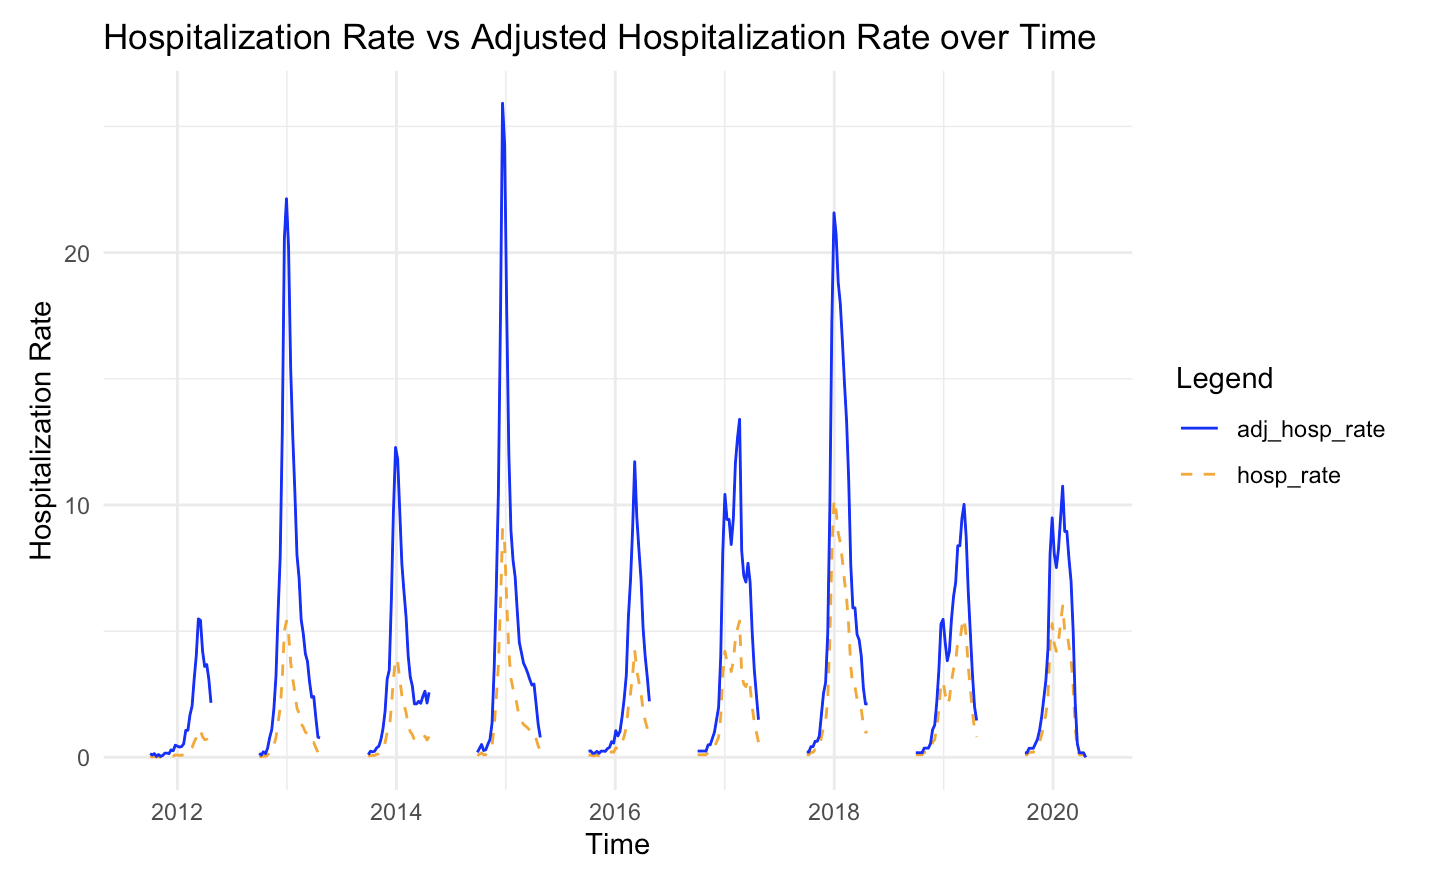
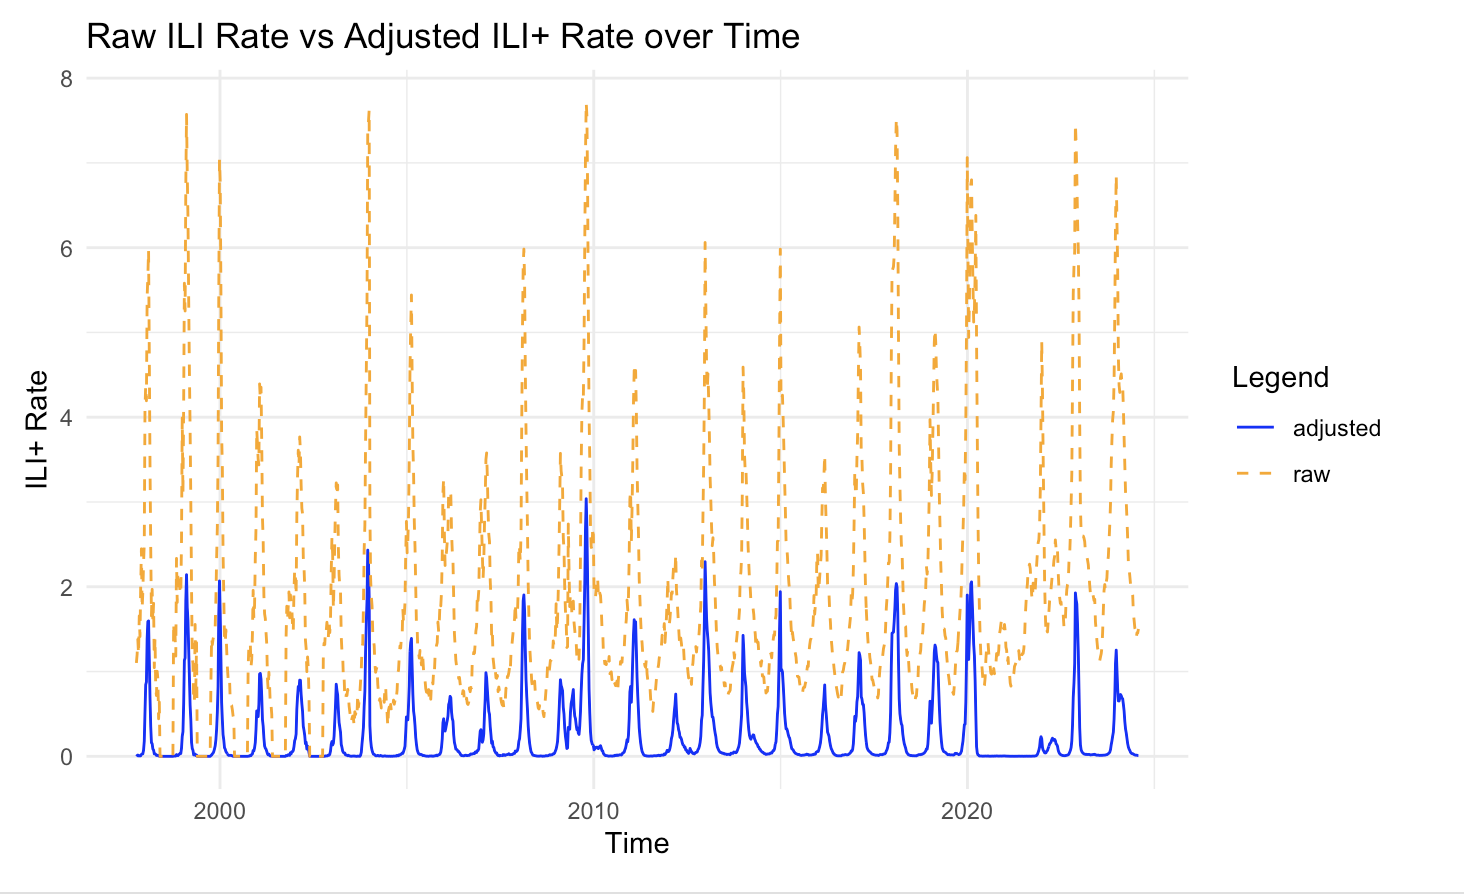
In this project, my task is to reproduce the data preprocessing steps of Flusion, the winning model for last year’s Flu forecasting competition. To my surprise (again), one of their main efforts is integrating and stabilizing various data sources.
Some examples:
In my Time Series class, I remembered getting exposure to many fancy models, but this specific experience helps me reinforce the importance of data quality - garbage in, garbage out!